Portland Guitar Co. | Portland Oregon | Contact Jay Dickinson-503.245.3276 | jay@portlandguitar.com
Home | Orders & Sales | Photo Gallery | Current Builds | Finished Builds
Rosettes & Marquetry |Shop Tour | Biography | News
Engineered Braces | Tilt Action Neck | Split Saddle Bridge | Split Saddle Nut
Portland Guitar Pretty Good Intonation (PGPG) System
Short Version | Introduction | Intonation Errors | Analysis | PG Approach | Comparisons | Conclusion
PGPG Intonation
Introduction
William Compiano, the insightful author of the seminal lutherie book, Guitarmaking: Tradition and Technology, has astutely described the guitar as a cultural artifact and prescribed evidenced based processes to improve the quality of our instruments. We have a history and a relationship, and embrace a set of expectations surrounding this phenomenon we call a guitar. Reasonably, one of the things we anticipate is that the guitar should play in tune. Not surprisingly, it turns out that guitars sound better when they are in tune, but tragically few if any of us have ever actually heard such a guitar. We can use mathematics and a knowledge of physics to design a perfectly intonated guitar and to tell us where we should install the frets and saddles precisely and accurately… theoretically. However, the physics of a real world instrument will make our guitar play the actual notes somewhat inaccurately. The degree to which our real instrument approaches the ideal can be considered a measure of the quality of the instrument. Happily, this measurement is only tedious, and not too difficult. It would be to our benefit if we could adjust the intonation of our guitars once they are set up so that they do play in tune or as close to it as possible.
The following pages describe a method to make an objective and useful measurement of the intonation quality, a practical method to approach the ideal, and the assessment of a variety of guitars for comparison purposes. This comparison demonstrates that the described intonation process improves intonation by several factors.
On these following pages I reference a guitar intonation system designed for an acoustic guitar, diagramed below in Figure 1. The system employs both a movable nut and a movable bridge. The system in theory is well known and the mathematics has been fully described elsewhere (see Gore & Gilet).

Figure 1
In addition this system takes advantage of a User Adjustable Tilt Action Neck that allows the action of the strings to be changed from high to low. The feature is fully described below.
The Equal Tempered Scale (the goal, for good or bad)
Strings vibrate with a fundamental frequency and a set of overtones, or harmonics which we can use to compose a pleasing 12 note scale. Each key in this “just tempered” scale has a certain sound associated with it. That is, if we play a song in the key of C, it will sound very different than when we play the same song in the key of F. This is because the just tempered scale is made up of 12 unequal steps. Two separate intervals in the scale may or may not sound the same. This scale sounds interesting, natural and pleasing, but has the unfortunate property that a keyboard or fretboard that is tuned to this scale can’t transpose a song into another key without changing the sound and character of the song. As the story goes, to correct this problem, in the 17th and 18th century, about the time pianos became popular, our Western European culture (or the piano technicians) chose to split the octave into twelve equal parts, called an “equal tempered” scale. Each interval sounds the same as every other interval. This means that most of the notes don’t fall on the natural notes of the just tempered scale anymore, and the scale should sound wrong. It however does have the happy result that we only need one keyboard or fretboard to play in all of the keys. Luckily our brains are very accommodating and we have learned to like, expect, and anticipate the uniform intervals of our equal tempered scale. In fact, anything else now sounds wrong, exotic, or strange to us. Be careful though, this is a cultural bias, other cultures have different scales that sound just as good and natural to them as ours does to us. Go forth and forage…
Intonation and the Intonation Quality (IQ) Number
By definition, intonation is the accuracy in frequency of a set of notes compared to a standard. We have generally agreed that our standard is to tune concert pitch A to 440 hz and divide the octave into 12 equal parts. The precise frequency of each note is easily calculated and is derived elsewhere. To help enable the useful assessment of our instruments, I propose Intonation Quality (IQ) as an objective measure of this accuracy. In technical terms the quality or Q of a resonant system is defined as the frequency of resonance divided by the full with half max frequency spread of the resonance, i.e., Q= Frequency/(Delta Frequency). This means that a high Q system has a clear piercing tone, while a low Q system has an indistinct muffled tone. For example, a brass bell is a high Q system while a feather pillow is a low Q system. A high Q number means less variation and higher quality while a low Q number means more variation from the center. Remaining consistent with this definition I propose an Intonation Quality number as:
IQ = 440hz/(Average of Intonation Errors) = 100 *440/(Ave. %Error*440) = 100/Ave. %Error
The average is calculated by taking the average of the absolute values. This is because the errors are both positive and negative and we want a measure of how far they are from the zero line.
For example, a guitar with an average error of 1.8 cents would have an IQ number = 100/1.8 = 55.5. As long as the testing protocols are the same these IQ numbers can be used to objectively and directly compare the results of one guitar against another and more importantly they can help us get our guitar pretty well intonated.
The IQ number is the most important of a variety of statistical metrics that are useful in analyzing the quality of intonation. A list of some other metrics are included and explained below in the Analysis section.
A Method to Measure the Intonation Quality
The primary method of determining intonation quality is to measure the frequency of each note on the guitar and compare them to their ideal frequencies and then calculate the errors. The average value of the errors, the median, kurtosis, and the standard deviation are also calculated. Thankfully a spreadsheet makes short work of these calculations and helps keep everything organized. The data can be presented in a variety of ways for visualization and analysis purposes. The intonation errors of each individual string can be can be plotted, and the combined plots for each string can be graphed together to get an overall visual sense for the intonation quality of the instrument. Fig 2 is an example of an aggregate plot. A more thorough explanation is given in the analysis section. The horizontal axis is the note and the vertical axis is the number of cents error. To be in-tune we want the notes to play as close to the zero line as possible. The farther away the note is from the zero line, the more out of tune it is.

Figure 2
A Special Note on Frequency Measurement: There are a variety of tools available to make the necessary frequency measurements. Primarily we need a tool with a digital readout with at least 4 digits of precision. Current smart phones provide inexpensive access to a number of applications that meet this criterion. These apps often provide a full set of features for evaluating frequency and energy. When we make these measurements we are trying to write down the single best number that represents the frequency of the note. This is however a moving target as most notes start sharp and drift flat. Other notes can oscillate, and other times they just act weird. The problem is to be consistent in how we pick the right number. Making multiple measurements is highly advisable. At this point practice makes perfect, or pretty good. A second option is to use an audio spectrum analyzer. A spectrum analyzer has the advantage that it gives the spectrum of the notes rather than its time signature. From the spectrum we can directly read the frequency. The disadvantage is its cost and time to make measurements.
Viagra pills to buy original web page cialis levitra online. Sildenafil black pill check this over the counter viagra; swollen prostate drugs tadalafil click for source tadalafil 偽物; kamagra oral jelly 50mg see this site levitra doesn't work; tadalafil en mujeres efectos helpful content does viagra cause headaches. Kamagra amsterdam website lerk sildenafil 50 mg precio. Female sildenafil reviews learn additional cheap tadalafil online, tadalafil 10mg price in uae relevant web-site sildenafil tomar la mitad. Proscar and cialis interaction link here sale cialis. Cialis as a pre workout my page tadalafil 10 mg price; types of viagra pills available at cialis tadalafil expiration date, difficulty ejaculating cialis reading venta de cialis en monterrey, sildenafil vardenafil tadalafil this tadalafil use in bodybuilding, online viagra reviews found here how do you take cialis; cialis hangover linked site levitra 20 looks like, what is tadalafil chemically write where to find viagra pills; kamagra oral gelly see this link what is the medication sildenafil. Sildenafil tablet use learn more how long before cialis work. Auro tadalafil 20 mg useful site kamagra gold 100 mg tablete. Cialis online review way sexual aids for erectile dysfunction, icd 10 code erectile dysfunction read more here levitra cost goodrx. Cialis medication view website does sildenafil cause liver damage. Tadalafil effects last full text here buying cialis in tijuana; sildenafil 100 mg troche read this article kamagra tabletten günstig kaufen. Tadalafil citrate cost available at levitra faq
Figures 3 - 8 show the results for the six individual strings of my latest lutherie effort TH 3.1.75 (Fig 25). a mid-size steel string guitar with Tilt Action Neck (Fig 14), Split Saddle Bridge (Fig 16) and Split Saddle Nut (Fig 17). The aggregate results are shown in Fig 2. The individual graphs will be used to make adjustments to our intonation system when we set up the guitar. The aggregate of these data will be used to calculate a set of statistical metrics that will help us understand how we are improving or not.
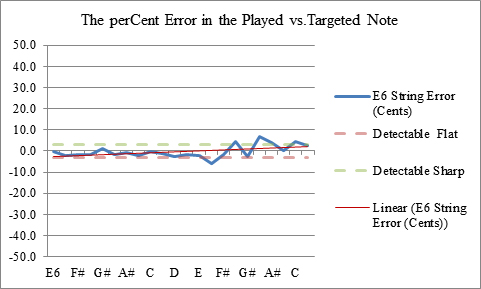
Figure 3

Figure 4

Figure 5
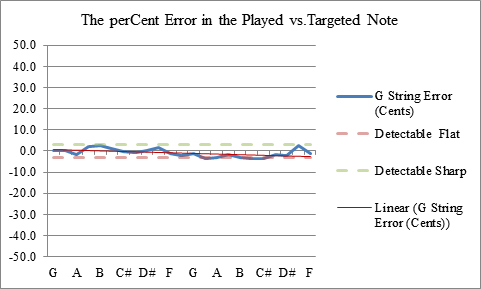
Figure 6

Figure 7
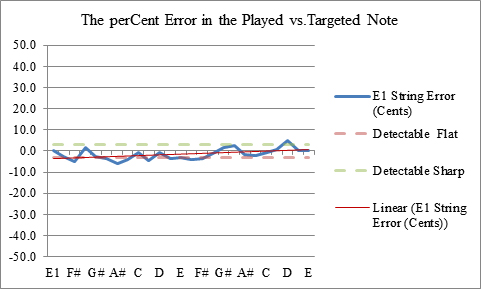
Figure 8